Network Forensics with Wireshark: A Methodological Guide

Wireshark is a useful tool in network forensic as it allows digital forensic experts to capture and analyze network traffic transmitted through the network. With the ability to dissect hundreds of network protocols and view packet-level details, Wireshark is an instrument to detect suspicious activities, diagnosing network issue and perform comprehensive network forensic investigations. This blog is about the methodology of utilizing Wireshark effectively to perform detailed network forensic analysis.
With this guide, we will be using this pcap (rogue-user.pcap) file to perform our analysis.
Methodology used in this guide
- Initial Overview
- Analyze Protocol Hierarchy & Conversations
- Usage of Display Filters
- Examine TCP Streams & Protocol Usage
- Analyze Packet Contents
- Document Findings
Initial Overview
This would be our first step to have a surface level of understading of the packet capture. We can use the Capture File Properties under Statistics tab and it will show crucial information such as encapsulation, time captured, number of packets and bytes etc. Let’s get start and analyze it.
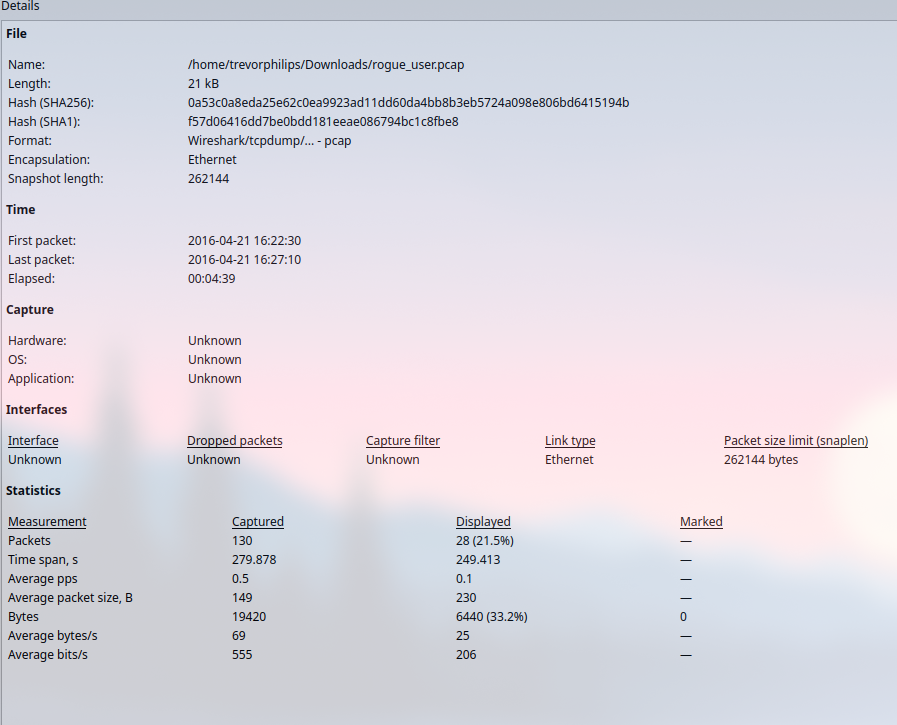
From here, we able to derive a couple information:
- Total time captured: 4 minutes 39 seconds
- Total packets captured: 130
- Encapsulation and link type: Ethernet
Based on this information, we can acknowledge that the Ethernet encapsulation and link type suggest this capture was taken in a typical LAN environment. This is consistent with many corporate or home network setups.
Analyze Protocol Hierarchy & Conversations
Next step is to view a hierarchical structure of the whole packet capture and relative endpoints conversations. First we will be viewing the protocol hierarchy, by accessing Protocol Hierarchy under Statistic tab.

With protocol hierarchy, we able to narrow down our objective, which is to find out the rogue user with the network. We notice a section of “Data” packets encapsulated in TCP along with some malformed packet. We can pay more attention on this detail first and gather more information on the endpoint conversation.
Endpoint conversation basically summarize which IP address ‘talks’ to whom and how much they are ‘talking’. Is it one ‘talks’ way too much than another. Again, head to Analytics tab and choose Conversations (Endpoints will do as well, but it doesnt show the conversation between two endpoints).

From here, we will understand the traffic flow between each endpoints based on IP address.
So here is an overview:
1. Addresses Involved:
- 192.168.56.1 to 192.168.56.101:
- Main communication path with 99 packets exchanged, totaling 16 kB of data.
- This traffic utilizes TCP, as indicated by the stream ID.
- 192.168.56.100 to 255.255.255.255:
- Broadcast traffic with 4 packets and 2 kB of data.
- The broadcast address
255.255.255.255suggests network discovery or service announcements, likely using UDP.
2. Traffic Details:
- 192.168.56.1 ↔ 192.168.56.101 (TCP):
- Packets A→B (from
192.168.56.1to192.168.56.101): No packets observed. - Packets B→A (from
192.168.56.101to192.168.56.1): 37 packets sent, totaling 3 kB of data.
- Packets A→B (from
- 192.168.56.100 → 255.255.255.255 (UDP):
- Packets A→B (from
192.168.56.100to255.255.255.255): 4 packets, contributing to 2 kB of data.
- Packets A→B (from
3. Protocols:
- TCP:
- Found in the connection between
192.168.56.1and192.168.56.101(stream ID 0).
- Found in the connection between
- UDP:
- Present in the broadcast traffic from
192.168.56.100to255.255.255.255(stream ID 1).
- Present in the broadcast traffic from
We can shift our focus to the 192.168.56.101 as it transfer 62 packets to 192.168.56.1. We can conclude this is an activity of a service response or data retrieval with the previous information we gather from protocol hierarchy view.
Usage of Display Filters
Before we use the filters, listing down our previous findings will be helpful to keep us on track.
- TCP stack contain data
- IP address 192.168.56.101
With these information, we can prepare display filters as such
- data && ip.src==192.168.56.101
This display filters will shows the packets that contain raw data in TCP stack and which originating from 192.168.56.101
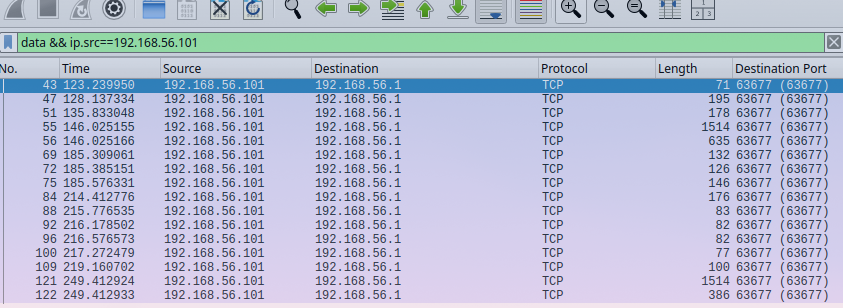
We have successfully narrow down to 16 packets from 130 packets. Moreover, we notice from source port of 5555 which suggest the default port for service name. Based on our hypothesis, we have confirm our findings.
Examine TCP Streams & Protocol Usage
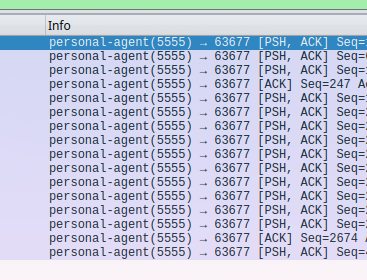
We can place our eyes on this part as we will noticed destination port, source port and protocol (which directly relates to port).
Before start analyzing, recap with TCP handshake:
- SYN (Synchronize): The client sends a SYN packet to initiate the connection.
- SYN-ACK: The server responds with a SYN-ACK to acknowledge the SYN request.
- ACK (Acknowledge): The client sends an ACK, confirming the connection is established, and communication begins.
But, this shows only the PSH,ACK flags which indicates that there is some form of data is being pushed to without waiting for arrival packets and yet a delay of received packets. For port wise, source-port is 5555 which is indicating a usage of particular service and port 63677 is an ephemral port for TCP.
More importantly, there is one packet has unreasonable huge amount of data size (1448 bytes), which is packet number 55. We should analyze futher with its contents.
Analyze Packet Contents
We can follow the TCP stream of the packet and it will decode the content to human-readable text.
These are the output:
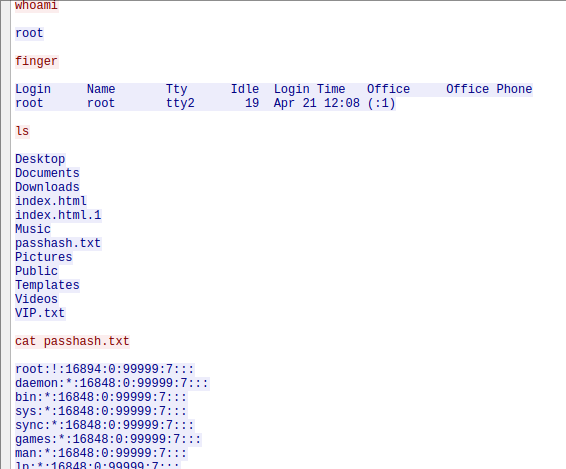
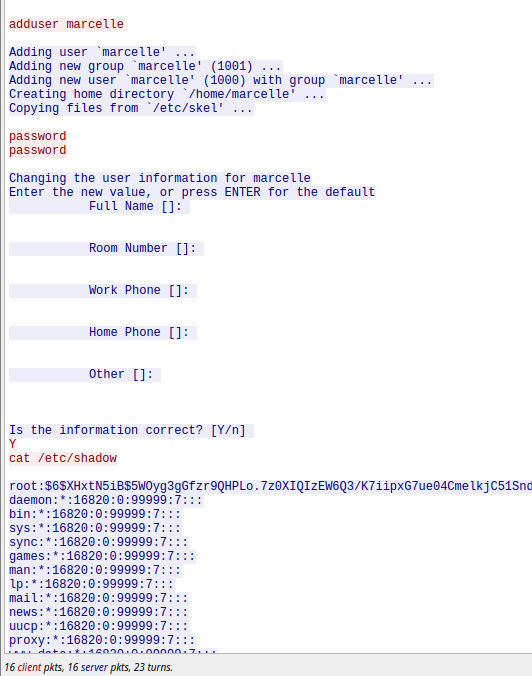
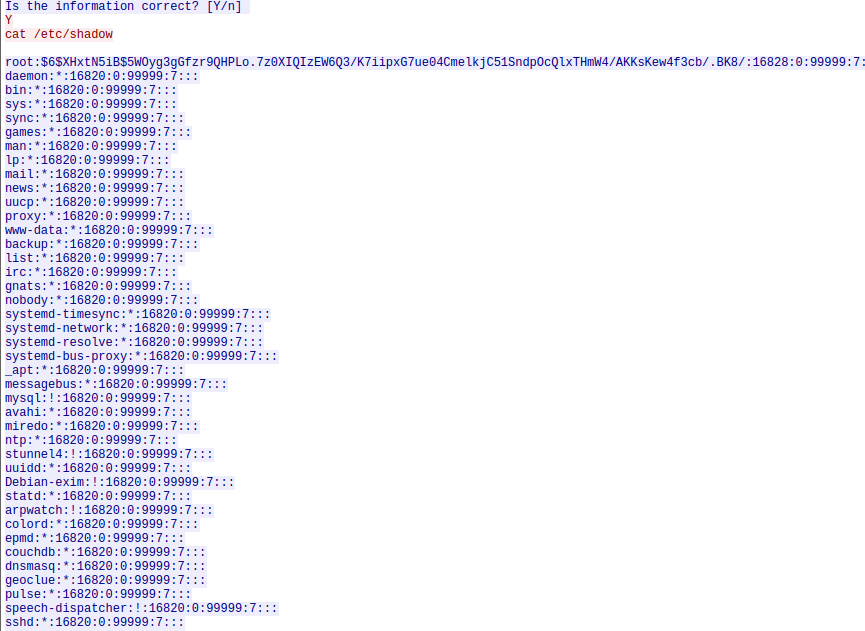
The pink text is the request to the victim and blue text is the response. So what actually happen is that a remote shell execution whereby the attacker run command such as whoami, finger, ls and then cat a file named passhash.txt that appears to be the output of the /etc/shadown file. We could identify the evidence of rogue user creation of marcelle with the command of adduser.

Final step would be our documentation of findings.
Document Findings
This Wireshark PCAP analysis file is captured over 4 minutes 39 seconds in a LAN environment. In this packet, we able to identify the IP address of the attacker which is 192.168.56.101 which communicates with the victim of IP address 192.168.56.1. The network activity has revealed unauthorized access of root privileges and rogue user creation in the victim machine. The activity has been carried out through the usage of port 5555 and notable key actions from attacker by the command execution and accessing files. We able to conclude that attacker’s ability to access privileged files suggests root-level access was obtained.